DATA SHARE Jan-Sep 2025
China’s GlassFiber and Products Import & Export Overview (January–September 2025)
1. Export Performance
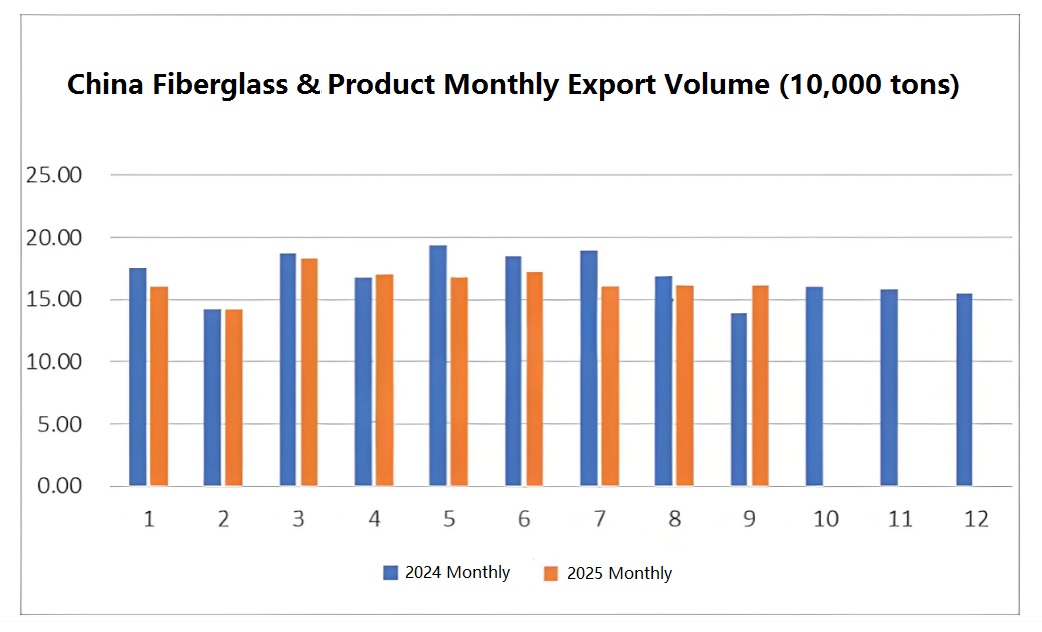
From January to September 2025, China’s total export volume of glassfiber and related products reached 1.4785 million tons, representing a 4.5% year-on-year decrease.
However, the total export value rose to US$2.125 billion, a 1.3% increase year-on-year.
Export prices maintained a steady upward trend throughout the first three quarters, with an average unit price growth of 6.1% year-on-year.In September 2025, the monthly export volume reached 161,400 tons, marking a 0.2% month-on-month increase and a 16.4% year-on-year surge — the first significant monthly rise this year.
The export value for the month was US$229 million, showing a 2.9% month-on-month decrease but a 15.7% year-on-year increase.
Breakdown by Product Category
The five major product categories — yarns, woven fabrics, mechanically bonded mats, chemically bonded mats, and prepregs/other products — had the following September export volumes:
- Yarns: 93,000 tons (57.4%)
- Woven fabrics: 26,000 tons (16.2%)
- Mechanically bonded mats: 7,000 tons (4.5%)
- Chemically bonded mats: 19,000 tons (11.5%)
- Prepregs and others: 17,000 tons (10.4%)
Month-on-month growth rates for these five categories were +5.2%, -1.7%, -6.4%, -10.7%, and -6.6%, respectively, while year-on-year growth rates stood at +21.4%, +22.3%, -6.8%, +23.7%, and -7.8%.
Top Export Items by Tariff Code
Among 31 detailed tariff items, the top three export products in September were:
- E-glass direct roving – 60,400 tons
- Chopped strands ≤ 50mm – 27,400 tons
- Chemically bonded glassfiber mats – 14,800 tons
These three products together accounted for 63.6% of the month's total exports. The lowest export volume was for woven plain fabrics (≤30 cm width, coated or laminated), with only 9.7 tons exported.
Top Monthly Growth Rates
The highest month-on-month growth was recorded in:
- Yarn open-mesh woven fabrics ≤30 cm (+206.4%)
- Other chemically bonded dense woven fabrics (+46.2%)
- Yarn open-mesh woven fabrics >30 cm (+31.0%)
Together, these three categories accounted for 1,097.47 tons of exports. The sharpest decline was seen in coated or laminated plain woven fabrics ≤30 cm, with exports down 56.6% to 9.7 tons.
2. Import Performance
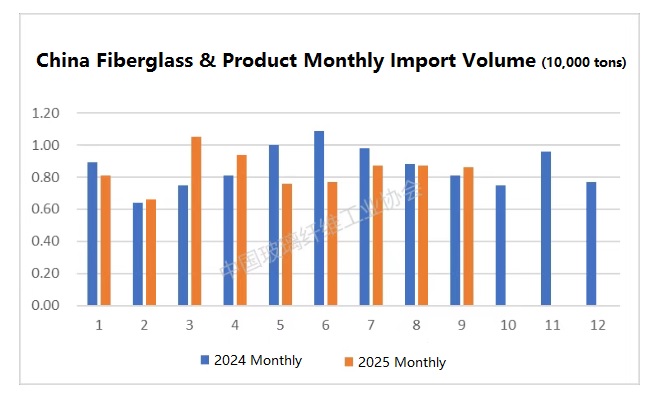
From January to September 2025, China’s total import volume of glassfiber and related products was 75,900 tons, a 3.3% year-on-year decrease.
However, the import value climbed to US$866 million, a sharp 36.8% increase year-on-year, driven by higher average prices.
The average import price for the first three quarters was US$11,409.75 per ton, up 41.5% year-on-year.
In September 2025, imports reached 8,600 tons, a 0.9% month-on-month decline but a 6.8% year-on-year increase, breaking the continuous downward trend observed since May.
The import value for the month was US$106 million, representing a 3.9% month-on-month increase and a 45.1% year-on-year increase.
Breakdown by Product Category
September imports for the five major categories were:
- Yarns: 6,200 tons (71.8%)
- Woven fabrics: 900 tons (10.9%)
- Mechanically bonded mats: 220 tons (2.6%)
- Chemically bonded mats: 210 tons (2.4%)
- Prepregs and others: 1,100 tons (12.3%)
Month-on-month growth rates were -5.9%, +0.4%, +97.3%, -25.5%, and +34.2%, while year-on-year growth rates were +11.4%, +1.7%, +54.6%, -60.1%, and +15.1%, respectively.
Top Imported Items by Tariff Code
The top three imported products in September remained:
- Chopped strands ≤ 50mm – 3,200 tons
- E-glass direct roving – 1,700 tons
- Chopped strands > 50mm – 900 tons
Together, these accounted for 67.4% of total imports. There were zero imports of open-mesh woven fabrics >30 cm, and imports of other chemically bonded mesh fabrics were only 11 kg.
Top Monthly Growth Rates
The three fastest-growing import categories were:
- Other chemically bonded dense woven fabrics (+746.6%)
- Mechanically bonded glassfiber mats (+596.5%)
- Other nonwoven glass fibre webs, boards, or similar products (+420.1%)
Combined, these three categories amounted to 225 tons of imports. The steepest decline was in open-mesh woven fabrics >30 cm, which saw zero imports in September.
Source from: China Fiberglass Industry Association